

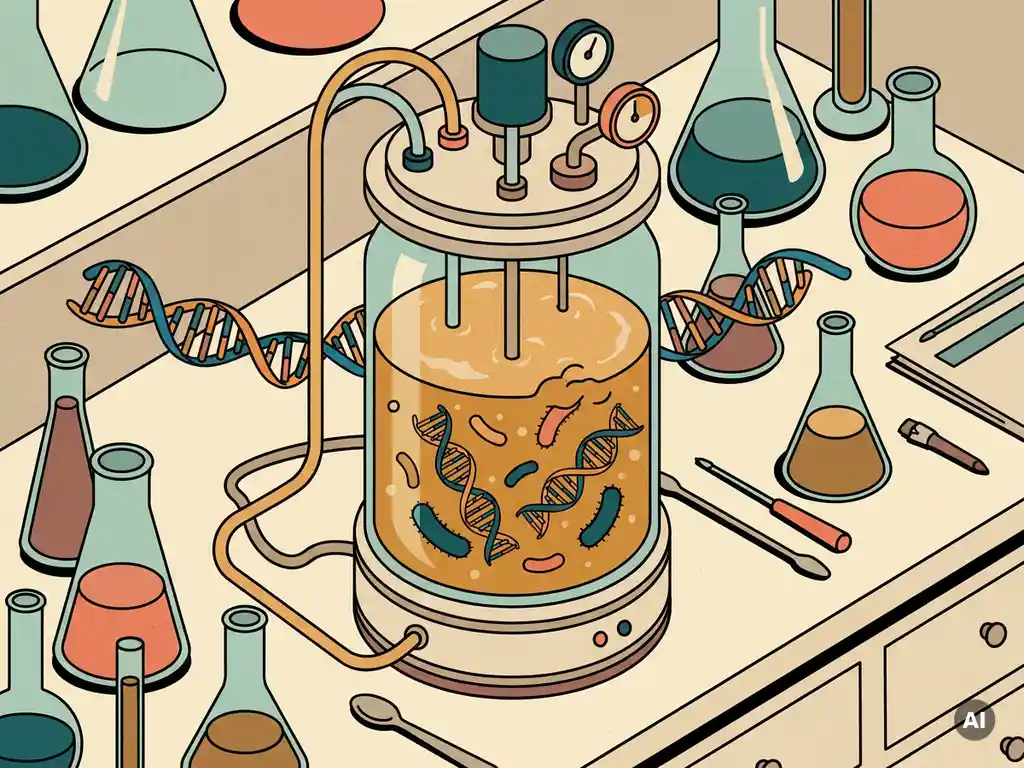
Amplicon sequencing is a DNA-based technique that identifies which microorganisms are present in a sample by targeting and amplifying a specific genetic marker region, then sequencing the results. In fermentation, it is used to profile the microbial community inside a reactor, revealing which bacteria, archaea, or fungi are active and in what relative proportions. The sections below address the most common technical questions fermentation R&D teams ask when evaluating this tool.
How does amplicon sequencing reveal what’s living in a fermentation reactor?
Amplicon sequencing works by extracting DNA from a fermentation sample, amplifying a short, highly conserved genetic region shared across microorganisms, and sequencing the resulting fragments. Each unique sequence variant corresponds to a distinct microbial taxon, allowing researchers to build a detailed picture of microbial community composition without needing to culture individual organisms in the lab.
The most commonly targeted region in bacteria is the 16S rRNA gene. This gene contains both conserved regions, which serve as universal primer binding sites, and variable regions that differ enough between species to act as a fingerprint. By comparing the sequenced fragments against curated reference databases, it becomes possible to assign taxonomy to each sequence variant, right down to the genus level and sometimes species level, depending on the region sequenced and the database used.
In practice, a fermentation sample is taken from the reactor, DNA is extracted, the target gene region is amplified using PCR, and the resulting amplicons are sequenced using next-generation sequencing platforms. The output is a dataset of thousands to millions of short reads that, after quality filtering and bioinformatic processing, translates into a ranked list of microbial taxa and their relative abundances. This makes amplicon sequencing a powerful tool for microbial community analysis in fermentation processes.
What types of microorganisms can amplicon sequencing detect in fermentation?
Amplicon sequencing can detect bacteria, archaea, and fungi in a fermentation sample, depending on which genetic marker is targeted. Bacterial and archaeal communities are typically profiled using the 16S rRNA gene, while fungal communities are identified using the ITS (Internal Transcribed Spacer) region. The choice of target region determines which part of the microbial community is made visible.
In most industrial fermentation contexts, bacteria are the primary focus. The 16S rRNA approach is well established, with extensive reference databases and standardized protocols. For anaerobic digestion processes, archaea such as methanogenic species are also highly relevant, and the 16S approach covers these as well. When fermentation involves yeast or filamentous fungi, ITS sequencing is added to the workflow.
It is worth noting that amplicon sequencing detects presence and relative abundance, not absolute cell counts. It also cannot directly distinguish between living and dead cells, since DNA can persist after cell death. This is an important limitation to keep in mind when interpreting results, particularly in processes where rapid community shifts are expected.
{div style=”box-sizing: border-box !important; margin: 32px 0 !important; padding: 28px 32px !important; background-color: #004070 !important; background-image: linear-gradient(135deg, #004070 0%, #003057 100%) !important; border: none !important; border-left: 4px solid #36a9e1 !important; font-family: ‘Exo’, sans-serif !important; text-align: center !important; line-height: normal !important;”}
{p style=”margin: 0 0 6px 0 !important; padding: 0 !important; font-family: ‘Exo’, sans-serif !important; font-size: 12px !important; font-weight: 500 !important; color: #36a9e1 !important; text-transform: uppercase !important; letter-spacing: 1.5px !important; line-height: 16px !important;”}Get in Touch{/p}
{p style=”margin: 0 0 8px 0 !important; padding: 0 !important; font-family: ‘Exo’, sans-serif !important; font-size: 20px !important; font-weight: 500 !important; color: #ffffff !important; line-height: 26px !important;”}Let’s Talk Microbial Solutions{/p}
{p style=”margin: 0 0 20px 0 !important; padding: 0 !important; font-family: ‘Exo’, sans-serif !important; font-size: 14px !important; font-weight: 300 !important; color: #ffffff !important; line-height: 20px !important;”}Book a conversation with Stijn, our CEO, or send us your request.{/p}
{table style=”border-collapse: collapse !important; border-spacing: 0 !important; margin: 0 auto !important; padding: 0 !important; width: auto !important;” cellpadding=”0″ cellspacing=”0″ role=”presentation”}
{tr style=”margin: 0 !important; padding: 0 !important;”}
{td style=”margin: 0 !important; padding: 0 6px 0 0 !important; white-space: nowrap !important;”}
{a href=”https://avecom.be/contact-2/” style=”display: inline-block !important; box-sizing: border-box !important; margin: 0 !important; padding: 11px 24px !important; background-color: #95c11f !important; color: #ffffff !important; font-family: ‘Exo’, sans-serif !important; font-size: 14px !important; font-weight: 500 !important; text-transform: uppercase !important; text-decoration: none !important; border: none !important; line-height: 18px !important; letter-spacing: 0.3px !important; white-space: nowrap !important;”}Book an Appointment{/a}
{/td}
{td style=”margin: 0 !important; padding: 0 !important; white-space: nowrap !important;”}
{a href=”https://avecom.callista.be/contactus” style=”display: inline-block !important; box-sizing: border-box !important; margin: 0 !important; padding: 9px 24px !important; background-color: transparent !important; color: #ffffff !important; font-family: ‘Exo’, sans-serif !important; font-size: 14px !important; font-weight: 500 !important; text-transform: uppercase !important; text-decoration: none !important; border: 2px solid #ffffff !important; line-height: 18px !important; letter-spacing: 0.3px !important; white-space: nowrap !important;”}Request Information{/a}
{/td}
{/tr}
{/table}
{/div}
How is amplicon sequencing different from metagenomics?
Amplicon sequencing targets a single, predefined genetic marker to identify who is present in a microbial community. Metagenomics sequences all DNA in a sample without targeting any specific gene, providing information not just on community composition but also on the functional genes those microorganisms carry. The two approaches answer different questions and involve different costs and analytical complexity.
For most fermentation monitoring and process optimization work, amplicon sequencing is the more practical choice. It is faster, less expensive, and produces data that is easier to interpret when the primary goal is tracking shifts in microbial community structure over time. Metagenomics becomes relevant when you need to understand what the community is capable of doing at a metabolic level, for example, identifying which organisms carry specific biosynthetic pathways or antibiotic resistance genes.
A useful way to frame the distinction is this: amplicon sequencing tells you who is in the reactor, while metagenomics tells you what they can do. For routine microbiome monitoring in fermentation R&D, amplicon sequencing provides the necessary resolution at a fraction of the cost and turnaround time of full metagenomic analysis.
Why do fermentation processes fail when microbial composition isn’t monitored?
Fermentation processes fail without microbial monitoring because shifts in community composition often precede process failure by days or weeks, and without sequencing data, those shifts are invisible until performance metrics collapse. By the time pH drops unexpectedly, yields fall, or contamination becomes apparent, the underlying microbial cause may already be entrenched and difficult to reverse.
In mixed-culture fermentation systems, community composition is not static. Environmental pressures such as substrate changes, temperature fluctuations, pH drift, or oxygen exposure can selectively favor certain organisms over others. A population that was a minor component of the community at 1% relative abundance can become dominant within a few generations if conditions shift in its favor. If that organism is a contaminant or an undesirable metabolite producer, the consequences for process performance can be severe.
The challenge is compounded during scale-up. Conditions that appear well controlled at lab scale are rarely perfectly replicated at pilot or production scale. Mixing gradients, oxygen transfer rates, and substrate concentration profiles all change with reactor volume, and these differences can drive community composition in unexpected directions. Without regular microbial profiling, R&D teams are effectively navigating the scale-up process blind.
This is one of the core reasons that Avecom integrates amplicon sequencing and qPCR into fermentation R&D projects as standard monitoring tools rather than as a last resort when something goes wrong.
When should amplicon sequencing be used during a fermentation R&D project?
Amplicon sequencing is most valuable at three distinct stages of a fermentation R&D project: during initial process development to characterize the starting microbial community, during optimization and scale-up to track how the community responds to process changes, and during troubleshooting when performance deviates from expectations. Using it only when problems arise misses much of its diagnostic potential.
During process development
Early-stage sequencing establishes a baseline community profile. This baseline is essential for interpreting later data. Without knowing what the community looked like at the start, it is impossible to determine whether a later shift is the result of a deliberate process change or an uncontrolled variable. For projects working with complex mixed cultures, baseline profiling also helps identify whether the inoculum is consistent from batch to batch.
During scale-up and optimization
As a process moves from lab scale to pilot scale, regular amplicon sequencing at defined intervals allows the team to confirm that the community structure is being preserved. If the community begins to drift, sequencing data provides the information needed to identify which organisms are changing in abundance and under what conditions, making it possible to adjust process parameters before performance is affected.
During troubleshooting
When a fermentation run underperforms, yield drops, or an unexpected metabolite appears, sequencing can rapidly identify whether a microbial cause is responsible. Comparing the community profile from a failing run against a successful reference run often points directly to the organism or group of organisms responsible for the deviation.
What does amplicon sequencing data actually look like, and how is it interpreted?
Amplicon sequencing data is delivered as a table of sequence variants and their read counts across samples, paired with taxonomic assignments. Each row represents a distinct microbial taxon, and each column represents a sample. The numbers reflect relative abundance, meaning the proportion of total reads assigned to each taxon, not absolute cell counts. Interpreting this data requires both bioinformatic processing and biological context.
After raw sequencing reads are quality filtered, they are grouped into Amplicon Sequence Variants (ASVs) or Operational Taxonomic Units (OTUs), depending on the pipeline used. ASVs are increasingly preferred because they resolve differences at the single-nucleotide level, providing higher taxonomic resolution. Each ASV is then matched against a reference database such as SILVA or Greengenes to assign a taxonomic label, typically at the phylum, class, order, family, genus, and sometimes species level.
The resulting dataset is usually visualized as stacked bar charts showing community composition across samples or time points, diversity metrics that quantify how rich and even the community is, and ordination plots that reveal how similar or different samples are from one another. For fermentation process optimization, the most actionable insights typically come from tracking relative shifts in key taxa over time and correlating those shifts with process performance data such as yield, pH, or gas composition.
One important interpretive principle is that amplicon sequencing data is compositional. Because all abundances are expressed relative to the total, an increase in one taxon mathematically decreases the apparent abundance of others, even if their absolute numbers have not changed. Experienced analysts account for this when drawing conclusions, and pairing amplicon data with quantitative methods such as qPCR helps anchor relative data to absolute cell numbers where precision matters.
For R&D teams without in-house bioinformatics capacity, working with a partner that handles both the sequencing and the biological interpretation of the data is often the most efficient path. Molecular analysis tools integrated into a broader fermentation R&D workflow, as offered through Avecom’s scientific team, ensure that sequencing results are connected directly to actionable process decisions rather than remaining as raw data files requiring separate specialist interpretation.