

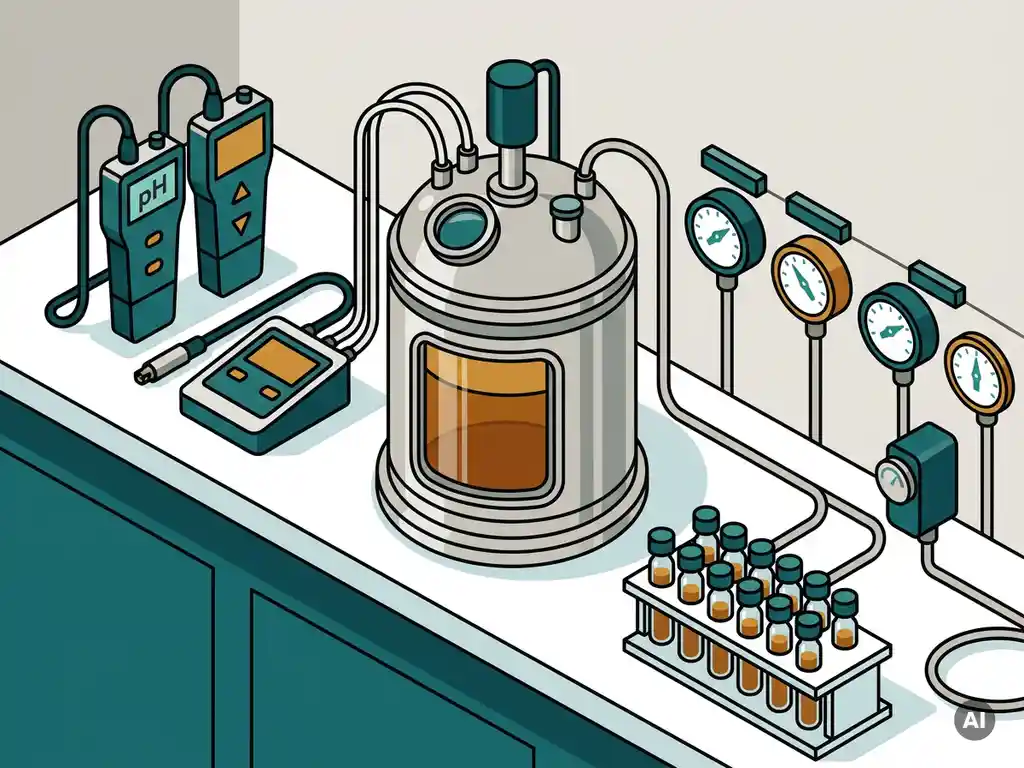
You benchmark fermentation process performance objectively by defining a core set of quantitative metrics, establishing a controlled baseline, and comparing results systematically across conditions, scales, or process variants. The key is separating process variables from biological variability so that performance differences are attributable to real causes, not measurement noise. The sections below walk through the specific metrics, methods, and decision points that make benchmarking meaningful in practice.
What metrics actually define fermentation process performance?
Fermentation process performance is defined by a combination of productivity metrics, efficiency ratios, and biological stability indicators measured under controlled conditions. No single number captures the full picture. A robust benchmarking framework typically includes volumetric productivity, substrate conversion efficiency, product yield, biomass concentration, and process stability over time.
The most commonly tracked fermentation KPIs fall into three categories:
- Productivity metrics: Volumetric productivity (g/L/h) measures how much product forms per unit volume per unit time. Space-time yield is a related metric that accounts for reactor downtime in batch processes.
- Efficiency ratios: Yield on substrate (g product per g substrate consumed) quantifies how well the microbial system converts input into output. Oxygen transfer efficiency and energy consumption per kilogram of product are relevant for aerobic processes.
- Biological stability indicators: Consistency of microbial community composition, contamination frequency, and batch-to-batch variability in product quality all reflect whether the process is robust enough for scale-up or commercial production.
Which metrics matter most depends on the application. For a protein fermentation process, yield on substrate and product purity are central. For a bioconversion or remediation process, conversion rate and selectivity take priority. Defining the right set of KPIs before benchmarking begins is not a formality. It determines what you measure, what you optimize, and ultimately what you can compare.
How do you set a meaningful baseline for benchmarking?
A meaningful baseline requires running the fermentation process under fully documented, reproducible conditions before introducing any variable. The baseline is not the best-case result. It is the reference state that represents your process as it currently operates, with all parameters held constant and all deviations recorded.
Setting that baseline involves several deliberate steps. First, fix all controllable parameters: temperature, pH, dissolved oxygen, agitation rate, feed composition, inoculum concentration, and sampling intervals. Second, run enough replicate batches to characterize natural process variability. A single run is not a baseline. It is a data point. Third, document every deviation from the target parameters, even minor ones, because unexplained variability in the baseline will make subsequent comparisons unreliable.
One common mistake is benchmarking against an idealized or theoretical performance target rather than an actual measured reference. Theoretical yields from stoichiometry are useful for calculating efficiency gaps, but they should not replace an empirically established baseline. The baseline must reflect what your process actually does, not what it should do in theory.
For organizations without existing fermentation infrastructure, establishing a credible baseline often requires access to controlled bioreactor systems with precise monitoring. This is one of the practical reasons companies work with specialized fermentation partners at the early stages of process development, where the goal is to generate reliable reference data before committing to a scale-up path.
Get in Touch
Let’s Talk Microbial Solutions
Book a conversation with Stijn, our CEO, or send us your request.
| Book an Appointment | Request Information |
What’s the difference between lab-scale and pilot-scale benchmarking?
Lab-scale benchmarking evaluates process feasibility and identifies optimal parameter ranges under tightly controlled, small-volume conditions. Pilot-scale benchmarking tests whether those parameters translate to larger reactors where mixing gradients, oxygen transfer limitations, and heat management introduce new variables. The two scales answer fundamentally different questions.
At lab scale, typically in reactors of one to ten liters, you can screen many conditions in parallel, iterate quickly, and gather high-resolution data on microbial behavior. The controlled environment minimizes confounding variables, which makes it easier to attribute performance differences to specific process changes. Lab-scale benchmarking is where you establish which parameters matter and what their optimal ranges are.
At pilot scale, typically from tens to hundreds of liters, the question shifts from “what works?” to “what transfers?” Mixing becomes non-uniform. Oxygen transfer rates change with reactor geometry. Temperature gradients appear. A process that performs well at two liters may show significant performance loss at 200 liters if the scale-up strategy does not account for these physical differences. Pilot-scale benchmarking therefore requires its own baseline, its own set of KPIs, and often additional analytical tools to diagnose where and why performance diverges from lab predictions.
The gap between lab and pilot is where many fermentation scale-up projects stall. Bridging it requires not just larger equipment but a systematic approach to identifying which process parameters are scale-sensitive and adjusting them accordingly before moving further toward production.
How can you benchmark mixed microbial cultures objectively?
Benchmarking mixed microbial cultures objectively requires community-level analytical methods alongside the standard process metrics used for pure cultures. Because the biological system is more complex, performance variability has more potential sources, and standard yield or productivity metrics alone cannot distinguish between a process problem and a community composition shift.
The core challenge is that mixed cultures do not have a fixed, known composition. Their performance depends on which microbial populations dominate under given conditions, how stable that community structure is across batches, and whether the community responds predictably to process perturbations. Benchmarking must therefore track both process outputs and community dynamics simultaneously.
Practically, this means combining conventional fermentation metrics with molecular monitoring tools such as amplicon sequencing, which profiles the relative abundance of microbial taxa, and quantitative PCR, which tracks specific functional populations. When a batch shows reduced productivity, this combined dataset allows you to determine whether the cause is a process parameter deviation or a shift in community composition, which are problems with very different solutions.
Mixed cultures also tend to show greater batch-to-batch variability than pure cultures, which means the baseline must be built from more replicates to characterize the natural range of community fluctuation. Once that range is established, deviations outside it become meaningful signals rather than noise. This approach turns what is often seen as a weakness of mixed-culture systems into a monitored, manageable variable.
Which tools and analytical methods support objective performance comparison?
Objective fermentation benchmarking relies on a combination of online process monitoring, offline chemical analysis, and molecular biological tools. The specific toolkit depends on the process type, but the principle is consistent: every performance claim must be traceable to a measured data point, not an observation or estimate.
Online and offline process monitoring
Online sensors track dissolved oxygen, pH, temperature, and off-gas composition in real time, providing continuous data on process state. These measurements form the foundation of any benchmarking dataset because they capture process dynamics that periodic sampling would miss. Offline measurements, including substrate and product concentrations via HPLC or spectrophotometric assays, biomass dry weight, and nutrient analysis, add chemical specificity that online sensors cannot provide.
Molecular and microbiome analytics
For processes involving complex microbial communities, amplicon sequencing of the 16S rRNA gene provides a detailed profile of community composition at each sampling point. Quantitative PCR allows targeted monitoring of specific functional groups. Together, these tools make it possible to correlate community structure with process performance, which is essential for diagnosing variability and validating that process changes produce the intended biological effect.
Statistical tools also belong in this category. Design of experiments frameworks, principal component analysis of multivariate datasets, and process capability indices translate raw measurements into comparable performance indicators. Without structured data analysis, even a comprehensive measurement dataset can yield ambiguous conclusions about which process variant actually performs better.
When should you involve a contract R&D partner in benchmarking?
Involving a contract R&D partner in fermentation benchmarking makes sense when your internal capabilities cannot generate the controlled, reproducible data that objective comparison requires. This typically applies when you lack pilot-scale bioreactor infrastructure, specialized analytical equipment, or the process expertise to design a statistically valid benchmarking study.
There are three situations where external involvement adds the most value. The first is at the baseline establishment stage, where access to well-instrumented reactors and experienced operators directly affects data quality. The second is at the lab-to-pilot transition, where scale-up expertise reduces the risk of misattributing performance loss to process design when the real cause is a physical scale effect. The third is when the process involves mixed microbial cultures, where community-level analytics require specialized equipment and interpretation skills that most internal R&D teams do not maintain in-house.
A contract partner also provides an independent reference point. When a process concept needs to be validated for investors, regulatory submissions, or internal decision-making, data generated in a third-party facility with documented quality systems carries more weight than data from the same team that developed the concept. Avecom, for instance, operates as an external fermentation expertise center for companies that need scientifically credible process data without building their own pilot infrastructure. As a spin-off of Ghent University, the scientific rigor behind the work is directly relevant when that data feeds into subsidy applications, patent filings, or investor conversations.
The decision to involve a partner is ultimately a question of time and risk. Building internal benchmarking capability takes months and significant capital. For companies under pressure to deliver proof of concept within a defined window, working with a partner who already has the infrastructure, methods, and expertise in place is often the faster and more cost-effective path to reliable performance data.